


6 min read
Getting a complete visibility of your SAP landscape is not a simple task, is it?
Even more so, providing your customers, management and colleagues with real-time status of the system can be complicated and time consuming.
This is where Avantra come to play.
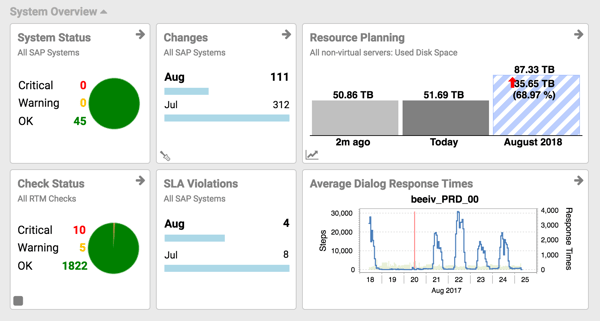
In Avantra V7 release we’ve added dashboards allowing Basis engineers, IT directors and CIOs each to see the information that is important to them when monitoring the health of SAP systems.
Dashboards may be private to a user or shared between all users of a given Customer. On top of that, dashboards can be created with view-only permissions for transparency to third parties including customers, subsidiaries, etc.
A user doesn’t have to have access toAvantra, they can access the dashboard with a direct URL.
Here is an example of a sample dashboard which can be accessed without having to install or configure it, one that you can give to your management team https://support.avantra.com/demo7/dashboard/TJC%20Dashboard
If you want to see it in details, watch this training video
Time presented on the dashboard can be adjusted allowing to see before and after performance (for example before and after HANA migration)

Dashlets - dashboard tiles
Avantra’s dashboards are built of dashlets these are basically the tiles that can be presented in a dashboard. Avantra offers dashlets in the following subjects:
- Systems - showing information about the status of specific system, multi-systems or a complete landscape, business services and compound checks, real-time SAP system health overview as well as information about SAP system availability and its compliance with the committed service level agreement (SLA)
- SAP system performance - show past, current (real-time) as well as forecast system performance and predictive resource planning
- Checks - provides information about real-time and daily checks status, allowing the Basis team to focus on debugging the correct elements - those that affect system performance or may lead to an even larger failure
- Changes - as Avantra tracks changes this dashlet allows you to easily see all changes in the system and were those assigned to anyone in the team
- Compliance - together with changes monitoring, SLA violationsת and unplanned downtime allows users to ensure compliance and be better prepared for an audit
- Tickets - when using Avantra’s ticketing system these dashlets provide information about assigned and unassigned tickets, their status as well as caller logs
- User activity - provides information on the signed users, and log book activities

Dashlets can be easily added, change their location and size on the dashboard. The dashlets are being updated periodically and can be adjusted to the user’s need.
Every dashboard can contain multiple sections, each grouping different dashlets and the design can be adjusted to fit your company’s brand, as you can see in this example

If you are ready to start creating your own dashboard, here is a step-by-step how-to create a dashboard
Don’t have Avantra? Contact us now and start your trial today.
Creating your own SAP dashboard
Creating and customizing a new dashboard is very simple.
Select Monitoring → Dashboards from the top-level menu. Select New.
- Fill in a Name and an optional Description. Select a Customer from the list and choose if the Dashboard is Shared, i.e. if other Users of the selected Customer shall be able to access the Dashboard as well.
- Push the Create button. A new tab opens with the title set to the name of the Dashboard.
- Adding Dashlets
- Click on + Add Dashlet. The Add new Dashlet window opens. Choose a Dashlet from the list. You can narrow down your selection if you choose one of the Categories first. Push the Add button of the Dashlet of your choice. The Configure page opens.
- There are options that depend on the particular Dashlet displayed in the upper part of the window. Usually, these options comprise some direct input or the definition of a Selector.
- The lower section consists of settings that are common to all Dashlets. You can choose the Grid Width and Grid Height of the Dashlet, or if it should Use the maximum window width. You can also Override Title and Override Subtitle which otherwise are selected automatically. Finally, you can choose a different Refresh Interval if the default is not suitable for you.
- Push the Apply button to save the Dashlet.
- Repeat the steps above to add further dashlets.
- Use your mouse and drag the Dashlets in order to rearrange them.
- In order to configure a Dashlet you already have added, push the icon inside the Dashlet.
- In order to remove a Dashlet, push the icon inside the Dashlet.
- Configuring the Dashboard
- Push Configure to open the Configure Dashboard window.
- You can change the Dashboard Name, Description, Customer, and the Shared flag, if you are no longer happy with the values chosen initially.
- If you don’t want to use the Floating Layout, which automatically adjusts the grid layout according to the browser window size, clear the corresponding flag.
- You can directly access the Dashboard using the URL defined in URL. If you don't want to allow direct access, clear the value in the field.
- By default, the page accessible by the URL defined above requires login. If you want to access this page automatically without a User to login, choose an appropriate Auto Login User from the list.
- Managing Sections
- Push the Add New Section button to add a new section to the Dashboard. A new section row will be added. Click on the name of the new section and change it accordingly.
- You can click on + to add a Dashlet from this dialogue directly.
- Choose 🠝 and 🠟 to rearrange sections.
- Choose to remove a section.
- Managing Styles
- You can set a different background color or use a background image, either by upload or by reference to an online resource.
- You can change the Title Color as well.
- You can disable the Dashlets being animated during refresh: clear the Animate Dashlets on refresh flag.
- Finally, you can Override CSS Styles by defining valid CSS in the text box.
- Caution: You should be familiar with web development and the usage of the appropriate tools.
- CSS classes involved are those starting with z-xdashboard and z-xdashlet.
- Push Apply to save your configuration settings.
- Push Exit Edit Mode to finish the Dashboard creation.
Don’t have Avantra? Contact us now and start your trial today.
Related Posts
ML based predictive analytics: To alert or not to alert?
As the only AIOps platform for automating SAP operations, Avantra performs the daily tasks that...
Understanding modern SAP Landscapes
Over the past 7 years, SAP Landscape transformation has been top of mind for many organizations....
Monitoring SAP hybrid cloud deployments, is it that simple?
Hybrid infrastructure/hybrid cloud environments in which the IT infrastructure contain a mix of...